 王张开
王张开echarts 解决浮窗被遮挡
问题如下,echarts 图表,鼠标移上去展示的浮窗,超出容器时被遮挡。 
类似于上面这样。 解决办法就是:
tooltip: {   //提示信息
        trigger: 'item',
        triggerOn: 'mousemove',
        confine: true  //解决浮窗被截断问题
},解决完效果: 
参考:
- https://blog.csdn.net/lixiaonaaa/article/details/115998953
- https://echarts.apache.org/zh/option.html#tooltip.confine
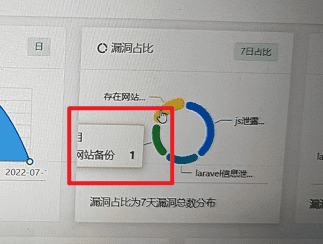
文字过长被截断
问题效果如下,echarts图表,这些 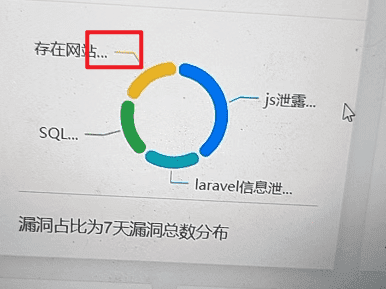
 解决:
解决:
html
<!DOCTYPE html>
<html lang="en">
<head>
	<meta charset="UTF-8">
	<title>Title</title>
</head>
<body>
<div id="main" style="height: 600px;width: 600px"></div>
</body>
<script src="https://cdn.bootcdn.net/ajax/libs/echarts/5.3.3/echarts.min.js"></script>
<script>
	var chartDom = document.getElementById('main');
	var myChart = echarts.init(chartDom);
	var option;

	option = {
		legend: {
			top: 'bottom'
		},
		toolbox: {
			show: true,
			feature: {
				mark: {show: true},
				dataView: {show: true, readOnly: false},
				restore: {show: true},
				saveAsImage: {show: true}
			}
		},
		tooltip: {
			confine: true,
		},
		series: [
			{
				name: 'Nightingale Chart',
				type: 'pie',
				radius: [50, 250],
				center: ['50%', '50%'],
				roseType: 'area',
				itemStyle: {
					borderRadius: 8
				},
				data: [
					{value: 40, name: '每日新增漏洞'},
					{value: 38, name: 'JavaScript泄露'},
					{value: 32, name: 'SQL泄露'},
				],
				label: {
					// 下面几个参数解决文字过长被截断或者...代替的问题
					position: 'outer',
					alignTo: 'edge',
					margin: 0,
					overflow: "break",  // 超过width就换行
					width: 60,  // 整个文本宽度,也不能太窄了, 不然都换行了,就不好看,这几个参数搭配调整最好
					fontSize: 12,  //显示文字的大小
					align: 'left',
				}
			}
		]
	};

	option && myChart.setOption(option);

	// 根据外部盒子大小,图表自适应大小
	window.onresize = () => {
		this.myChart.resize();
	};
</script>
</html>效果: 